21 KiB
Return to Ritherdon: Photosensitive Epilepsy
This document is part of the health and safety risk assessment for the artworks Personal Flash in Real Time (Andy) and Personal Flash in Real Time (Tony) which are part of the Return to Ritherdon exhibition. If you would like to know more about how the artwork and the exhibition, head to Return to Ritherdon Doc's.
This assessment was produced by Craig Oates.
Summary of Assessment
The amount of flashes the artworks ('Personal Flash in Real Time (Andy)' and 'Personal Flash in Real Time (Tony)') produce are not of a high enough rate to cause a photosensitive epileptic seizure -- according to the referenced sources below ('between 3-30 hertz').
The two main reasons why the artworks don't produce a high enough flicker/flash rate are as follows:
- The devices controlling the lights in the gallery cannot receive enough new readings-per-second to reach the hertz required to cause a seizure (according the reference sources below); And,
- The welders in the factory do not alter the light levels (in their welding booths) at a high enough rate to trigger a seizure.
The majority of this assessment will focus on the second point. The reason why is because I can refer you to the link below to address the first point:
- Relay (the software controlling the lights in the gallery)
The highlighted line (on the linked page) indicates the gallery lights must wait 0.3 seconds until it receives the latest light reading (I.E. process three readings-per-second). This means the lights (in the gallery) can change states (I.E. off to on) at a rate of two hertz, at most.
To expand on the second point, I have analysed and reviewed a days-worth of live test data, collected on the 23/04/2021. Personal Flash in Real Time (Andy) (the light meter part of the artwork) took the light readings from 06:57 to 16:00 (approx. 9 hours). Also, the test was conducted under the intended environment and under real-world conditions.
The overall assessment of the data is the light meter took readings at a rate of four readings-per-second for approximately two (non-consecutive) hours. Within that time, the light meter produced readings which generated a flash rate of two hertz, at most. And, it reached this 'peak' for a total of three non-consecutive seconds throughout the nine hours. With the light meter demonstrating it has the potential to generate enough new readings-per-second, the gallery lights have a hard limit of three readings-per-second encoded into their systems (via their software).
Information About Photosensitive Epilepsy
According to Epilepsy Society, a flashing/flicker light between 3-30 hertz can trigger a seizure.
Between 3-30 hertz (flashes per second) are the common rates to trigger seizures but this varies from person to person. While some people are sensitive at frequencies up to 60 hertz, sensitivity under 3 hertz is not common.
More information available at:
- Epilepsy Society (home page)
- Epilepsy Action
- National Health Service (NHS)
How Risk Assessment Relates to the Return to Ritherdon Project
The artworks Personal Flash in Real Time (Andy) and Personal Flash in Real Time (Tony) this document refers to are two artworks which are, in effect, one system and part of a much bigger project (called Return to Ritherdon). Within these two artworks are flashing lights. Because of that, the rate of flashing/flickering the artworks produce needs reviewing as part of the health and safety risk assessment.
Overview of How the System Works
This is not a complete overview of how the system works. That is outside the scope of this document. Instead, this is a simplified version for the sake of brevity. For a more thorough overview, please use the following (documentaton) links:
The system consists of five devices but only the server (Midpoint) interacts with all its counterparts. There are two 'Light Meters' which reside in Ritherdon (factory) and two 'Gallery Lights' which communicate with each others opposite via the server. 'Each others opposite' refers to the two pairings between the light meters and gallery lights. Below is a diagram to help explain.
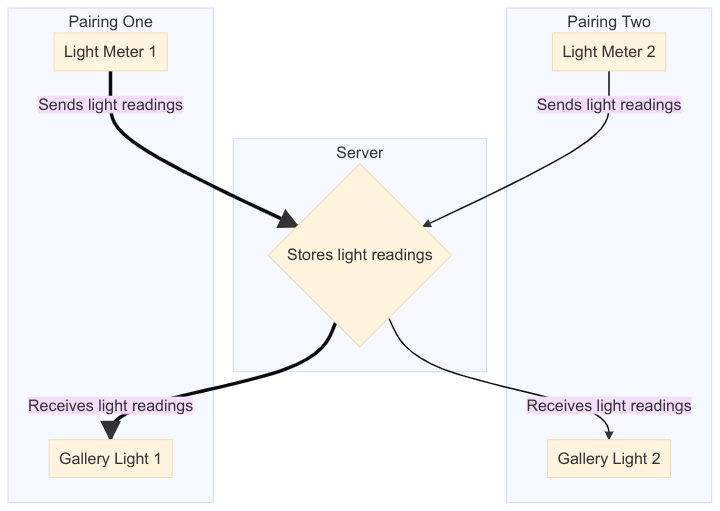
The diagram above shows the two pairings which consists of one 'Light Meter' and one 'Gallery Light'.
The important thing to note here is the lights in the gallery only turn on when welding is occuring in any of the welding booths in the factory. If no one is welding, the lights remain off.
Why the Readings-per-Second Rate is Fluctuates
As you work your way through this assessment, you will notice the system produces inconsistent amounts of (light) readings-per-second. The reason it fluctuates throughout the day is because of how the system measures the light. The quick version is the light meter is timing how long the light sensor (within the light meter) takes to charge, based on the amount of light hitting it. The more light hitting the sensor, the quicker it charges and reaches its limit before it discharges. If there is no or little light hitting the sensor, it will take longer to charge which means it will take longer to calculate what the current light level is. The amount of light in Ritherdon (factory) changes throughout the course of the day, hence the inconsistent readings-per-second rates. For more information on how the light meters measure the light levels, head to:
Accessing the Data
This document will only provide a summarised view of the data because of the size of the raw files and databases are rather large and cumbersome. If you would like to review the data used in this assessment please head to:
Otherwise, the more complete set of test data is available at:
- the Flicker project (takes you to the 'data' part of the repository)
How I've broken down the data files/directory is as follows:
data
├── results
│   ├── filtered_flicker_entries.csv
│   ├── flicker_list.csv
│   ├── readings_above_threshold.csv
│   └── readings-per-sec.csv
├── test-data.csv
└── test-data-lite.csv

1 directory, 6 files
As you can see, the test-data.csv and test-data-lite.csv reside in
the top most directory. And, these are the files which I passed
through
Flicker in
order to get the files in results. Technically, I used only
test-data.csv but test-data-lite.csv is a subsection of its larger
counter part. If your computer is stuggling to open the full-sized
test-data.csv file, I recommend falling back onto
test-data-lite.csv -- where you can see what the data at least looks
like.
I've omitted all databases used throughtout the project in the data
directory because of their unweildy size and niche use (outside
specialised environments/industries). Access to the SQLite databases
are available if needed.
Reading the Data
If you would like to see the data in situ, click on the following:
The data consists of three columns:
IdTime StampReading
Sampe of readings taken from test-data.csv
| Id | Time-Stamp | Reading |
|---|---|---|
| 7780379 | 2021-04-23 07:00:20.000000 | 5 |
| 7780380 | 2021-04-23 07:00:21.000000 | 11 |
| 7780381 | 2021-04-23 07:00:22.000000 | 11 |
| 7780382 | 2021-04-23 07:00:24.000000 | 11 |
| 7780383 | 2021-04-23 07:00:25.000000 | 11 |
| 7780384 | 2021-04-23 07:00:26.000000 | 11 |
| 7780385 | 2021-04-23 07:00:27.000000 | 11 |
| 7780386 | 2021-04-23 07:00:29.000000 | 11 |
| 7780387 | 2021-04-23 07:00:30.000000 | 12 |
| 7780388 | 2021-04-23 07:00:31.000000 | 12 |
| 7780389 | 2021-04-23 07:00:32.000000 | 12 |
For this assessment, you can ignore the Id column. I've kept it to
help preserve the nature of the data in its raw form -- after
converting it to a comma-seperated-value (CSV or .csv) file. I
converted the data because of the specialised nature of databases (in
this case a SQLite database). Essentially, the Id column refers to
the 'row Id.' for a particular reading. It makes it easier to refer to
a reading via its Id that its Reading value and/or Time-Stamp.
The Time-Stamp and Reading columns refer to the level of light
recorded at that speficied time. For example, at 2021-04-23 07:00:26.000000 (row 7780384), the amount of light recorded was
11. I should point out here, the time-stamp format is as follows:
YYYY-MM-DD Hr:Min:Sec:MicroSec(Hris 24-hour)
On top of that, every time-stamp has their MicroSec values set to
.000000. The code used to generate this data is responsible for
this. It just doesn't record it and is not a data conversion
issue. I've kept the data as close to its raw form as I can and the
.000000 is a consequence of that. The Light
Meter
project is responsible for generating the data.
How the values calculates and stored in Reading are out of scope for
this assessment (see Light
Meter
for more information) but the main take-away is the more light in the
welding booth, the higher the number. There are two welding booths in
the factory which this system monitors ('Light Meter 1' and 'Light
Meter 2' in the diagram above) and each one has their own threshold to
indicate when welding is occuring. For example, when the light level
for 'Light Meter 1' goes above 39 (at time of writing), this
indicates a staff member (Andy) in the 'first' welding booth is
welding which triggers the light to turn on in the gallery ('Gallery
Light 1'). Throughout the course of the day (factory operating hours
are 07:00-16:00), the system repeats this process and documents every
reading and the time it recorded it.
How the Data was Processed/Reviewed
I analysed using the code in the Flicker repository. Please review the code/repository there for more information on how the code works -- it is outside the scope of this document.
Breakdown of Data Analysis
Within the data directory, the results directory contains four files. These files are the result of the data analysis.
data
├── results
│   ├── filtered_flicker_entries.csv
│   ├── flicker_list.csv
│   ├── readings_above_threshold.csv
│   └── readings-per-sec.csv
├── test-data.csv
└── test-data-lite.csv

1 directory, 6 files
These four files are the results of the analysis conducted for this assessment. And, each file will have its own subsection below.
readings-per-sec.csv
Overall, the test data recorded 84,294 readings over the course of about nine hours. With that said, the readings-per-second rates fluctuated throughout those nine hours. To help explain, please review the table below,
(data taken from test-data.csv)
| Time-Stamp (YYYY-MM-DD Hr:Min:Sec:MicroSec) | Reading | Readings/sec |
|---|---|---|
| 2021-04-23 07:02:50.000000 | 17 | 1 |
| 2021-04-23 07:02:51.000000 | 17 | |
| 2021-04-23 07:02:51.000000 | 17 | 2 |
| 2021-04-23 07:02:52.000000 | 17 | 1 |
| 2021-04-23 07:02:53.000000 | 17 | 1 |
| 2021-04-23 07:02:54.000000 | 17 | 1 |
| 2021-04-23 07:02:55.000000 | 17 | 1 |
Note: The '.000000' is a artefact from the code's formatting of the data. You can ignore it. I've only kept it in to keep the data here aligned as close as possible with the raw and computed data data.
If you look at the time-stamp 2021-04-23 07:02:51.000000, you will
see there are two readings recorded. This sample is small but you can
see the remaining time-stamps have only one reading per each second
intervals. With this in mind, please note there are seven reading
spread across a five-second time-span.
When you calculate the amount of readings-per-second rates for all the
readings in test-data.csv, you will get the following results,
(Minutes and Hours rounded to nearest .5)
| Readings-per-Second | Seconds | Minutes | Hours |
|---|---|---|---|
| 1 | 5,344 | 89 | 1.5 |
| 2 | 2,955 | 49 | 1.0 |
| 3 | 13,284 | 221 | 3.5 |
| 4 | 8,297 | 138 | 2 |
| --------------------- | --------- | --------- | ------- |
| Total | 29,880 | 498 | 8.0 |
The way to read to table is as follows:
- for 5,344 seconds, the system operated at a rate of one reading-per-second
- for 2,955 seconds, the system operated at a rate of two readings-per-second
- for 13,284 seconds, the system operated at a rate of three readings-per-second
- for 8,297 seconds, the system operated at a rate of four readings-per-second
According to the sources listed above, 'between 3-30 hertz (flashes per second) are the common rates to trigger seizures'. To reach this rate, the system needs to have a readings-per-second rate of four or more. In this instance, the data shows the system can reach a rate of four-readings-per-second. This means the light meters can (technically) take enough readings-per-second to could trigger a seizure. I nullified this, though, by limiting the number of new readings the gallery lights can receive in a one second time period.
The reason why the rate needs to be four readings-per-second or higher -- and not three -- is because of the need for a 'starting state'. For example, let's say the first reading is 'off' and the second reading is 'on'. There is only one change in state but two readings. If you continue the process, you will require four readings to reach the minimum threshold of three changes in state (I.E. off to on) per second before you reach the quoted hertz limit to trigger a seizure:
- off (starting state -- no change)
- on (first state change)
- off (second state change)
- on (third state change)
What the data in readings-per-sec.csv shows is the system can
technically record enough readings-per-second to potentially trigger a
seizure. Although, it cannot do it at a constant rate. This result
meant I needed to expand my analysis of the data
(test-data.csv). But, I could limit the scope to the 8297 seconds of
recordings and not all of it.
readings_above_threshold.csv
To review the time periods were the light meter was recording above
three hertz, I needed to know there timestamps. This file is a list of
those times. If you would like to manually review each time period
where the light meter recorded at three hertz, you can cross-reference
the times in readings_above_threshold.csv with test-data.csv. This
file is an artefact of the filtering process and needed to generate
flicker_list.csv. For the most part, you can ignore this file.
flicker_list.csv
This file lists all the moments the light meter recorded at four readings-per-second and the light levels at those times. I should note here the gallery light paired with this light meter only turns on if the light level is above 39. Upon reading this list, it is apparent the gallery light does not always change its state (I.E. on to off) for every time frame. This meant I could reduce the list even more.
To help explain how to interpret the data, please consider the follow
sample from flicker_list.csv,
Note: The '.000000' is a artefact from the software's formatting of the data.
| Timestamp | Readings |
|---|---|
| 2021-04-23 09:04:07.000000 | ['41', '37', '36', '36'] |
| 2021-04-23 09:04:11.000000 | ['36', '38', '40', '37'] |
| 2021-04-23 09:04:14.000000 | ['36', '36', '37', '36'] |
| 2021-04-23 09:04:18.000000 | ['36', '36', '36', '36'] |
| 2021-04-23 09:04:22.000000 | ['36', '36', '36', '36'] |
| 2021-04-23 09:04:26.000000 | ['37', '37', '37', '37'] |
What it shows is the light level recordings taken at the specified
moment in time. For example, for the one second period at 2021-04-23 09:04:11.000000, the amount of light recorded in the welding booth
(in the factory) was 36, 38, 40 and 37. What's important to
note here is the light changed state only once during this time frame
(when above 39).
To expand on the point about noting the change in state, please
consider the following table (an expansion of the 2021-04-23 09:04:07.000000 timestamp),
| Time-Stamp (YYYY-MM-DD Hr:Min:Sec:MicroSec) | Reading | State |
|---|---|---|
| 2021-04-23 09:04:07.000000 | 41 | On |
| 2021-04-23 09:04:07.000000 | 37 | Off |
| 2021-04-23 09:04:07.000000 | 36 | Off |
| 2021-04-23 09:04:07.000000 | 36 | Off |
It shows, for the one-second period at 2021-04-23 09:04:07.000000,
the gallery light changed its state (from on to off) once. It does this
when the light level is above 39. This, in effect, demonstrates the
system flash rate was one hertz for that second.
filtered_flicker_entries.csv
The data in this file filters the data in flicker_list.csv down to
eight time periods. These are the times the light recorded at four
readings-per-second and cause the gallery light to change state at
least once. The format in this table is the same as
flicker_list.csv, so refer to that section for information on how to
read the data in flicker_list.csv.
The three main points to take away from this file are:
- The system never managed to reach the three hertz threshold;
- The system couldn't sustain the rate to potentially reach the three hertz threshold beyond one second; And,
- The system reached the readings-per-second rate to potentially reach the three hertz threshold for eight seconds over an approximate nine hours period.
What's important to note about the last point is eight seconds over nine hours is less than one second-per-hour. That's even if the system manage to cause the gallery light to flash at three hertz. To help explain the above, please see the table below,
Note: This is an expansion of
filtered_flicker_entries.csv. 'States' and 'Hertz' and not included
in the .csv file.
| Time-Stamp | Readings | States | Hertz |
|---|---|---|---|
| 2021-04-23 09:04:07.000000 | 41, 37, 36, 36 | on, on, off, off | 1 |
| 2021-04-23 09:04:11.000000 | 36, 38, 40, 37 | off, on, on, off | 2 |
| 2021-04-23 10:54:05.000000 | 39, 39, 40, 40 | on, on, on, on | 0 |
| 2021-04-23 10:54:07.000000 | 39, 39, 39, 40 | on, on, on, on | 0 |
| 2021-04-23 10:56:46.000000 | 40, 40, 39, 39 | on, on, on, on | 0 |
| 2021-04-23 10:57:13.000000 | 40, 41, 40, 39 | on, on, on, off | 1 |
| 2021-04-23 10:58:13.000000 | 39, 46, 44, 39 | off, on, on, off | 2 |
| 2021-04-23 11:00:11.000000 | 39, 42, 46, 39 | off, on, on, off | 2 |
The Human Element in The System
A point I haven't touched on yet is the involvement of the two members of staff, in Ritherdon (factory), operating the welders. Overall, it is the welders who trigger the gallery lights on and off. This means they would need to cause their welders to flicker/flash above three hertz which does not align with the types of jobs they are tasked with. Granted, this is a point without any immediate and explicit data recorded data to demonstrate this as fact. I can only imply it through the data analysis above. This section/point is more about providing extra context to the assessment.