15 KiB
Return to Ritherdon: Photosensitive Epilepsy
This document is part of the health and safety risk assessment for the 'unnamed' artwork in the Return to Ritherdon exhibition.
Summary of Assessment
The rate of flashes the lighting system produces is not of a higher enough rate to cause a photosensitive epileptic seizure -- according to the referenced sources below. Based on the live test data, the system produce a flash rate of 1 Hertz through out the course of one day between 06:57 and 16:00 (9 hours), on the 23/04/2021. This falls outside the 3-30 Hertz claimed by Epilepsy Society (link below).
Information About Photosensitive Epilepsy
According to Epilepsy Society, a flashing/flicker light between 3-30 hertz can trigger a seizure.
Between 3-30 hertz (flashes per second) are the common rates to trigger seizures but this varies from person to person. While some people are sensitive at frequencies up to 60 hertz, sensitivity under 3 hertz is not common.
More information can be found at:
- Epilepsy Society (home page)
- Epilepsy Action
- National Health Service (NHS)
How This Relates to the Return to Ritherdon Project
The project (unnamed at time of writing) this document refers to is one artwork in a much bigger project (called Return to Ritherdon). Within 'unnamed project', is flashing lights. Because of that, the rate of flashing/flickering the artwork produces needs reviewing as part of the health and safety risk assessment.
Overview of How the System Works
This is not a complete overview of how the system works. That is outside the scope of this document. Instead, this is a simplified version for the sake of brevity. For a more thorough overview, please use the following (documentaton) links:
The system consists of five devices but only the server (Midpoint) interacts with all its counterparts. There are two 'Light Meters' which reside in Ritherdon (factory) and two 'Gallery Lights' which communicate with each others opposite via the server. 'Each others opposite' refers to the two pairings between the light meters and gallery lights. Below is a diagram to help explain.
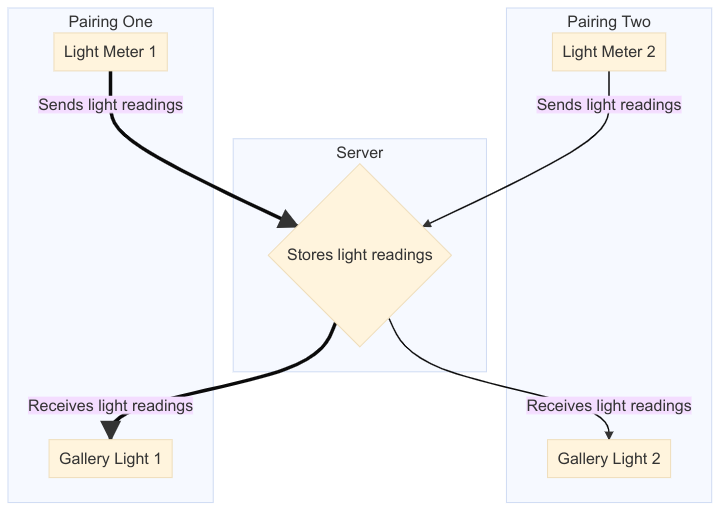
The diagram shows the two pairings which consists of one 'Light Meter' and one 'Gallery Light'. The 'Gallery Light' is usually referred to as 'Relay' but I've changed it here to highlight the factory-gallery relationship.
The important thing to note here is the lights in the gallery only turn on when welding is occuring in any of the welding booths in the factory. If no one is welding, the lights remain off.
Why the Readings-per-Second Rate is Fluxtuates
As you work your way through this assessment, you will notice the system produces inconsistent amounts of light readings per second. The reason it fluxtuates throughout the day is because of how the system measures the light. The quick version is the light meter is timing how long the light sensor (within the light meter) takes to charge, based on the amount of light hitting it. The more light hitting the sensor, the quicker it charges and reaches its limit. If there is no or little light hitting the sensor, it will take longer to charge which means it can determine what the current light level is. The amount of light in Ritherdon (factory) changes throughout the course of the day hence the inconsistent readings-per-second rates. For more information on how the light meters measure the light levels, head to:
Accessing the Data
This document will only provide a summarised view of the data because of the size of the raw files and databases are rather large and cumbersome. If you would like to review the data used in this assessment please head to:
Otherwise, the more complete set of test data is available at:
- the Flicker project (takes you to the 'data' part of the repository)
How I've broken down the data files/directory is as follows:
data
├── results
│   ├── filtered_flicker_entries.csv
│   ├── flicker_list.csv
│   ├── readings_above_threshold.csv
│   └── readings-per-sec.csv
├── test-data.csv
└── test-data-lite.csv

1 directory, 6 files
As you can see, the test-data.csv and test-data-lite.csv reside in
the top most directory. And, these are the files which I passed
through
Flicker in
order to get the files in results. Technically, I used only
test-data.csv but test-data-lite.csv is a subsection of its larger
counter part. If your computer is stuggling to open the full-sized
test-data.csv file, I recommend falling back onto
test-data-lite.csv -- where you can see what the data at least looks
like.
I've omitted all databases used throughtout the project in the data
directory because of their unweildy size and niche use (outside
specialised environments/industries). Access to the SQLite databases
are available if needed.
Reading the Data
If you would like to see the data in situ, click on the following:
The data consists of three columns:
IdTime StampReading
Sampe of readings taken from test-data.csv
| Id | Time-Stamp | Reading |
|---|---|---|
| 7780379 | 2021-04-23 07:00:20.000000 | 5 |
| 7780380 | 2021-04-23 07:00:21.000000 | 11 |
| 7780381 | 2021-04-23 07:00:22.000000 | 11 |
| 7780382 | 2021-04-23 07:00:24.000000 | 11 |
| 7780383 | 2021-04-23 07:00:25.000000 | 11 |
| 7780384 | 2021-04-23 07:00:26.000000 | 11 |
| 7780385 | 2021-04-23 07:00:27.000000 | 11 |
| 7780386 | 2021-04-23 07:00:29.000000 | 11 |
| 7780387 | 2021-04-23 07:00:30.000000 | 12 |
| 7780388 | 2021-04-23 07:00:31.000000 | 12 |
| 7780389 | 2021-04-23 07:00:32.000000 | 12 |
For this assessment, you can ignore the Id column. I've kept it to
help preserve the nature of the data in its raw form -- after
converting it to a comma-seperated-value (CSV or .csv) file. I
converted the data because of the specialised nature of databases (in
this case a SQLite database). Essentially, the Id column refers to
the 'row Id' for a particular reading. It makes it easier to refer to
a reading via its Id that its Reading value and/or Time-Stamp.
The Time-Stamp and Reading columns refer to the level of light
recorded at that speficied time. For example, at 2021-04-23 07:00:26.000000 (row 7780384), the amount of light recorded was
11. I should point out here, the time-stamp format is as follows:
YYYY-MM-DD Hr:Min:Sec:MicroSec(Hris 24-hour)
On top of that, every time-stamp has their MicroSec values set to
.000000. The code used to generate this data is responsible for
this. It just doesn't record it and is not a data conversion
issue. I've kept the data as close to its raw form as I can and the
.000000 is a consequence of that. The Light
Meter
project is responsible for generating the data.
How the values stored in Reading are out of scope for this
assessment (see Light
Meter
for more information) but the main take-away is the more light in the
welding booth, the higher the number. There are two welding booths in
the factory which this system monitors ('Light Meter 1' and 'Light
Meter 2' in the diagram above) and each one has their own threshold to
indicate when welding is occuring. For example, when the light level
for 'Light Meter 1' goes above 39 (at time of writing), this
indicates a staff member in the 'first' welding booth is welding which
triggers the light to turn on in the gallery ('Gallery Light
1'). Throughout the course of the day (factory operating hours are
07:00-16:00), the system repeats this process and documents every
reading and the time it recorded it.
How the Data was Processed/Reviewed
The data was analysed using the code in the Flicker repository. Please review the code/repository there for more information on how the code works -- it is outside the scope of this document.
Breakdown of Data Analysis
The sample of data reviewed for this assessment was taken from the
Light Meter readings produced by factory1 running the software
provided by
Light-Meter,
on the 23/04/2021. Overall, there was 84,294 light readings
taken over the course of between 8 to 9 hours. Also, this was a
live test with readings taken from the intended environment,
under real-world conditions. Of those readings, the number of
readings taken is as follows,
Note: Minutes and Hours are approximate values.
| Readings-per-Second | Seconds | Minutes | Hours |
|---|---|---|---|
| 1 | 5,344 | 89 | 1.5 |
| 2 | 2,955 | 49 | 0.8 |
| 3 | 13,284 | 221 | 3.5 |
| 4 | 8,297 | 138.28 | 2 |
| --------------------- | --------- | --------- | ------- |
| Total | 29,880 | 498 | 8.3 |
Let's say you have the following readings (sample taken from
test-data.csv stored in raw-data,
Note: The '.000000' is a artefact from the code's formatting of the data. You can ignore it. I've only kept it in to keep the data here aligned as close as possible with the raw and computed data data.
| Time-Stamp (YYYY-MM-DD Hr:Min:Sec:MicroSec) | Reading | Readings/sec |
|---|---|---|
| 2021-04-23 07:02:50.000000 | 17 | 1 |
| 2021-04-23 07:02:51.000000 | 17 | ----------- |
| 2021-04-23 07:02:51.000000 | 17 | 2 |
| 2021-04-23 07:02:52.000000 | 17 | 1 |
| 2021-04-23 07:02:53.000000 | 17 | 1 |
| 2021-04-23 07:02:54.000000 | 17 | 1 |
| 2021-04-23 07:02:55.000000 | 17 | 1 |
| 2021-04-23 07:02:55.000000 | 17 | 1 |
Note: I've omitted the Id column from the example above because is
not relevant for this assessment. If you review the raw data, you
will come across that column. More often than not, you can ignore it
if you're not looking to review/work with the code written for main
the system.
If you look at the time-stamp 2021-04-23 07:02:51.000000, you will
see there are two readings recorded. This sample is very small but you
can see the remaining time-stamps have only one reading per each
second intervals. With this in mind, please note there are eight
reading spread across a five-second time-span. That is why the /first/
table above is broken down into time and not just hard frequency
totals. For 5,344 seconds on 23/04/2021, the system took a light meter
reading at one reading-per-second.
According to the sources listed above, 'between 3-30 hertz (flashes per second) are the common rates to trigger seizures'. This means the number of readings to review can be reduced to those operating at four readings-per-second. This is because the lights in this system need to go from an off-state (1) to an on-state (2) and back to an off-state (3). The extra (fourth reading) is needed because there needs to be a starting state (a zero if you will). Below is a sample of a moment when four readings were taken in a one second period,
| Time-Stamp (YYYY-MM-DD Hr:Min:Sec:MicroSec) | Reading | State |
|---|---|---|
| 2021-04-23 09:04:07.000000 | 41 | On |
| 2021-04-23 09:04:07.000000 | 37 | Off |
| 2021-04-23 09:04:07.000000 | 36 | Off |
| 2021-04-23 09:04:07.000000 | 36 | Off |
Note: The light paired with factory1 is set to turn on (in the
gallery gallery1) when the reading is above 39.
In the table above, you will see the light changes state (on to off)
once. For it to reach the noted rate of 'between 3-30 hertz', the
third reading in the table will need to have been above 39 to
trigger the light back on. This would have made the light change from
on to off three times, taking into account the need for a 'starting'
state.
Referring back to the table listing the various rates of readings-per-second (the first table), there are only 8,297 readings (technically it's seconds but 'readings' is easier to process) instead of 84,294. This can be filtered down even more, though. This is because not all four readings-per-second occurrences cause the light to change its current state (I.E. it doesn't go from off to on). With this in mind, the number of entries to review drops to 8 when you list just the times when the light changes its state. They are,
| Time-Stamp | Readings | States | Hertz |
|---|---|---|---|
| 2021-04-23 09:04:07.000000 | 41, 37, 36, 36 | on, on, off, off | 1 |
| 2021-04-23 09:04:11.000000 | 36, 38, 40, 37 | off, on, on, off | 1 |
| 2021-04-23 10:54:05.000000 | 39, 39, 40, 40 | on, on, on, on | 0 |
| 2021-04-23 10:54:07.000000 | 39, 39, 39, 40 | on, on, on, on | 0 |
| 2021-04-23 10:56:46.000000 | 40, 40, 39, 39 | on, on, on, on | 0 |
| 2021-04-23 10:57:13.000000 | 40, 41, 40, 39 | on, on, on, off | 1 |
| 2021-04-23 10:58:13.000000 | 39, 46, 44, 39 | off, on, on, off | 1 |
| 2021-04-23 11:00:11.000000 | 39, 42, 46, 39 | off, on, on, off | 1 |
This tables shows the limitations of the system to trigger a photosensitive epileptic seizure. The system produced at most a flash rate of 1 Hertz over the course of approximately 8 to 9 hours of activity.This is below the '3 to 60 Hertz' claimed by Epilepsy Society (more references/links at the top of this file).